

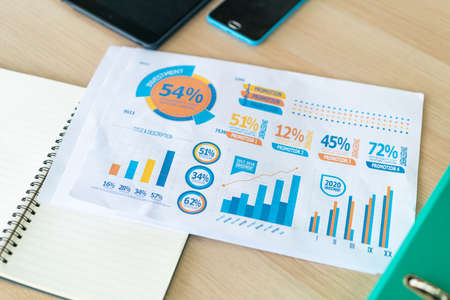
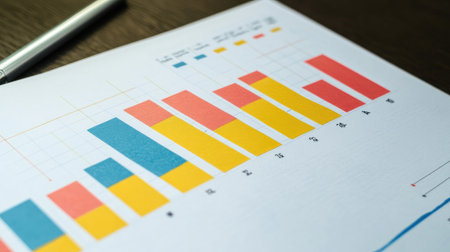
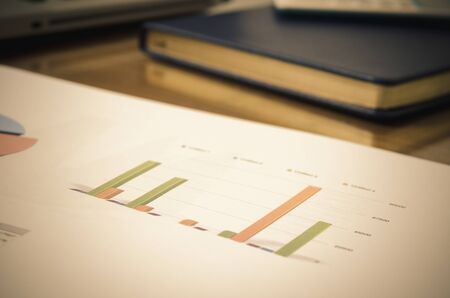
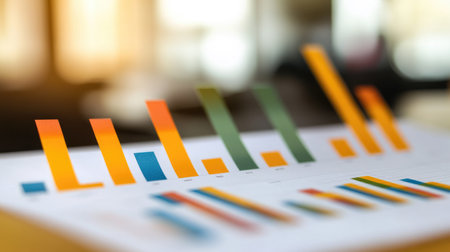
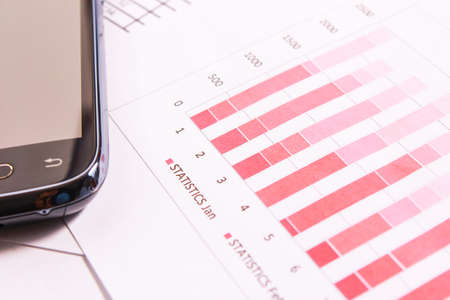
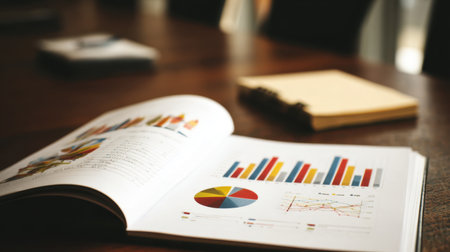
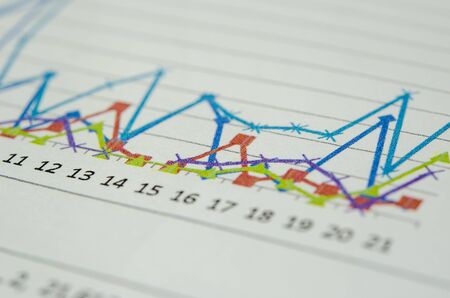
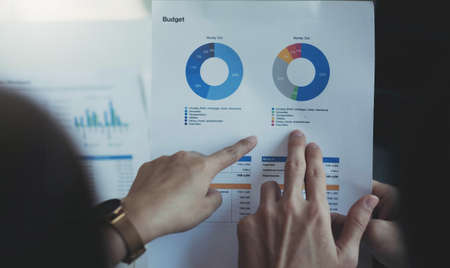
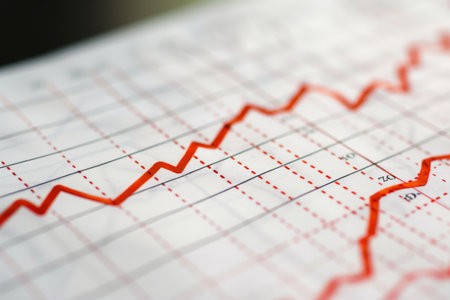
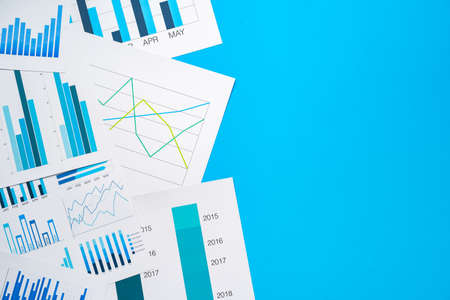
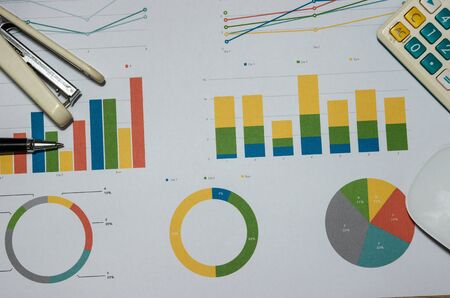
chart or graph paper. Financial, account, statistics and business data concept.
Коллекция по умолчанию
Коллекция по умолчанию
Создать новую
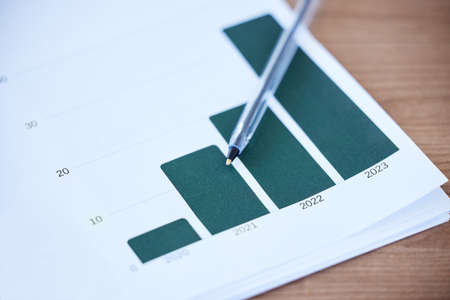
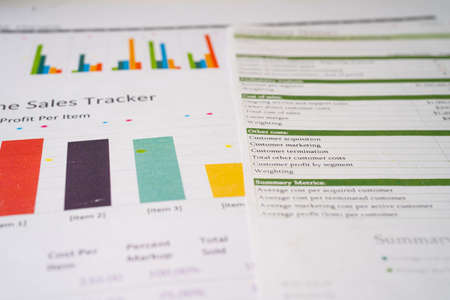
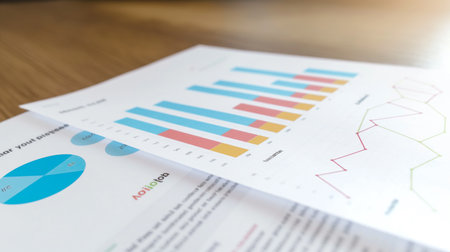
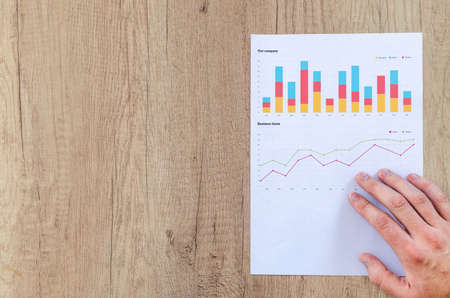
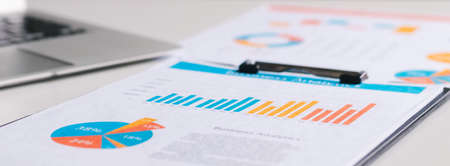
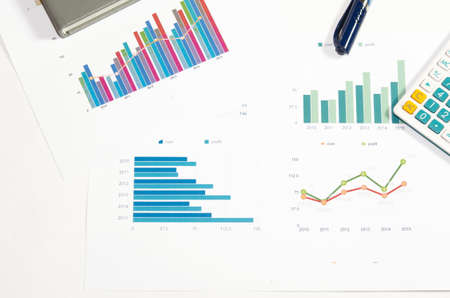
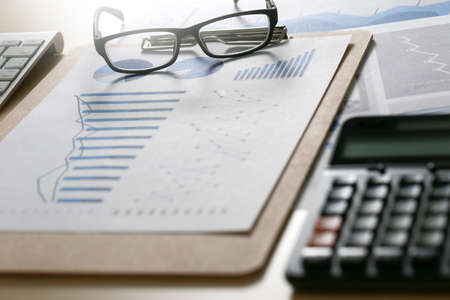
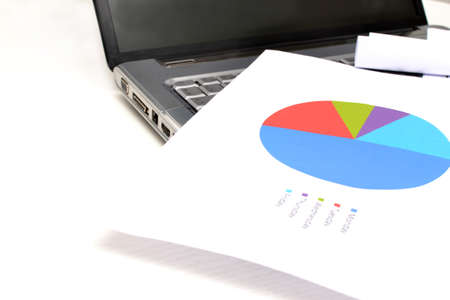
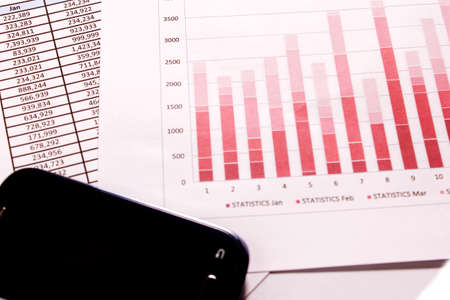
Our profits are on the rise. Shot of paperwork and stationery on a desk in an empty office during the day.
Коллекция по умолчанию
Коллекция по умолчанию
Создать новую
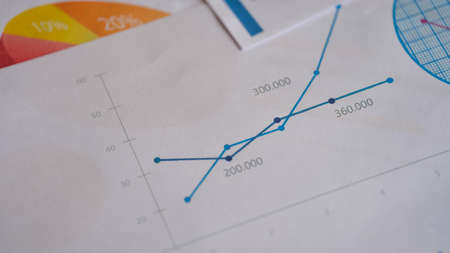
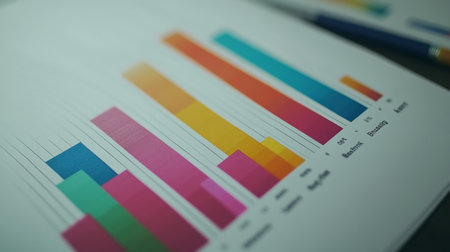
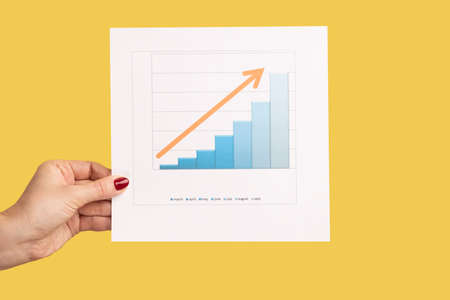
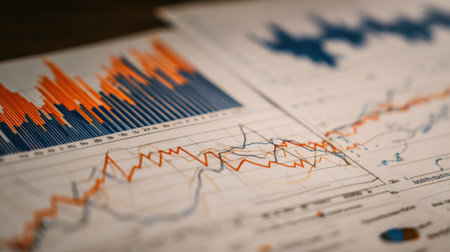
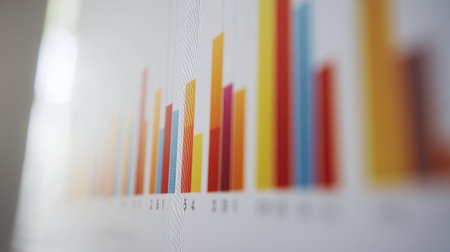
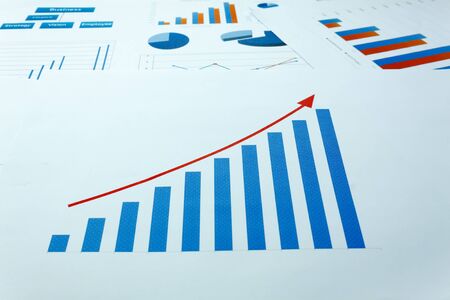
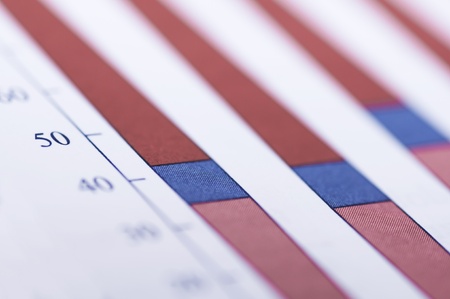
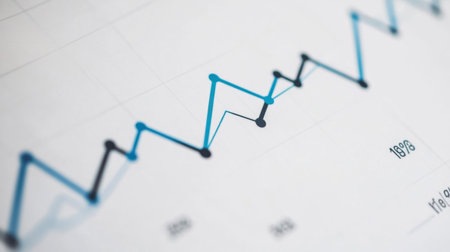
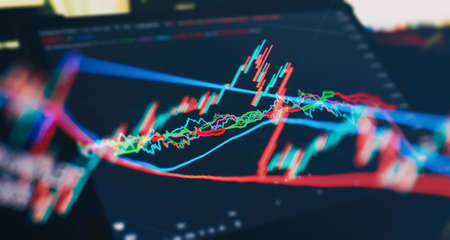
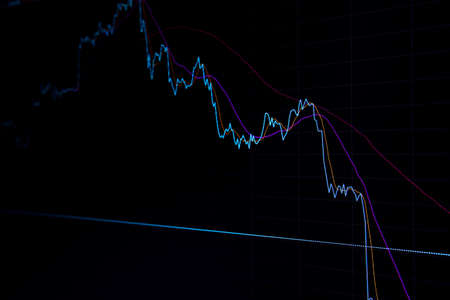
Data financial instruments chart, downtrend stock market analysis report
Коллекция по умолчанию
Коллекция по умолчанию
Создать новую

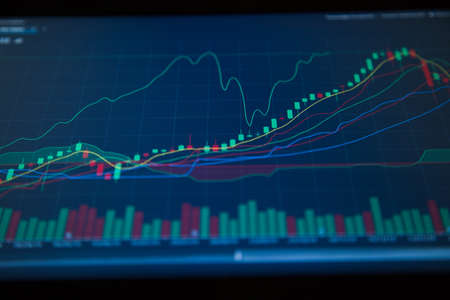
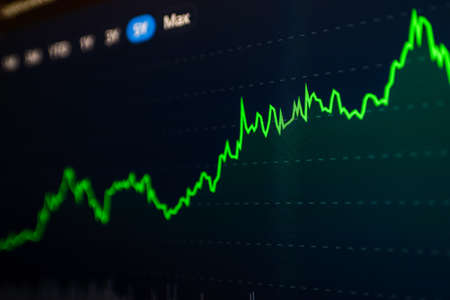
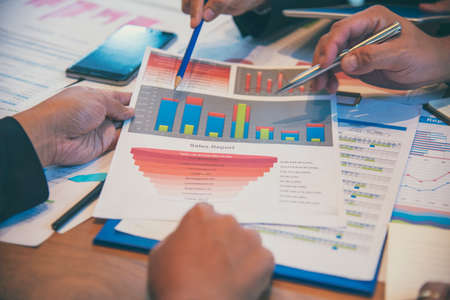
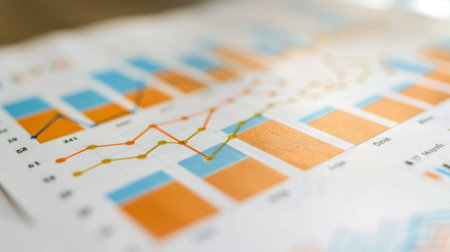
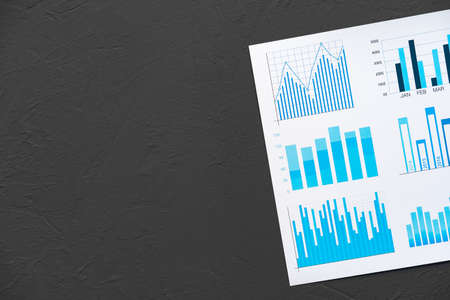
Analysis of data from graphs. select focus.
Коллекция по умолчанию
Коллекция по умолчанию
Создать новую
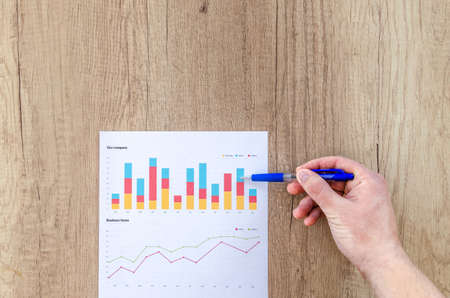
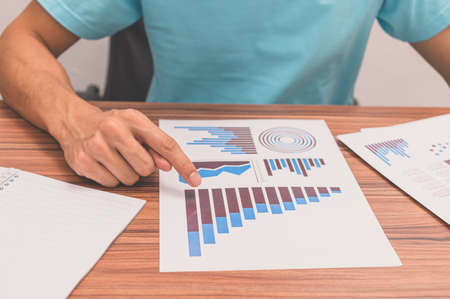
Man showing business graph on wooden table
Коллекция по умолчанию
Коллекция по умолчанию
Создать новую
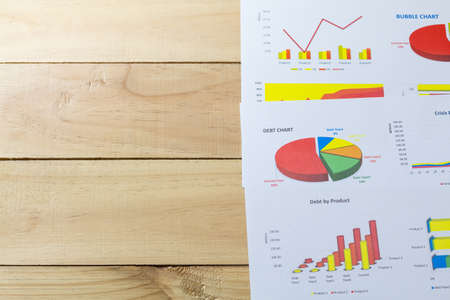
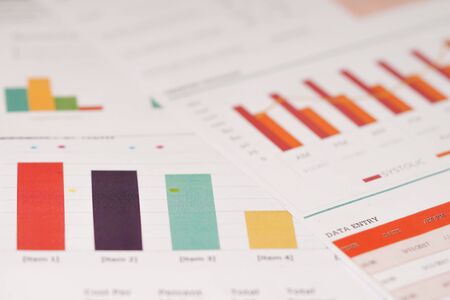
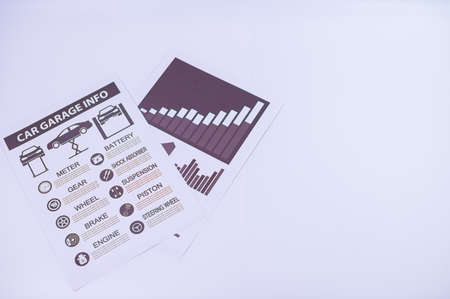
Documents with colourful charts, graphs and diagrams
Коллекция по умолчанию
Коллекция по умолчанию
Создать новую
Business graphs background.
Коллекция по умолчанию
Коллекция по умолчанию
Создать новую
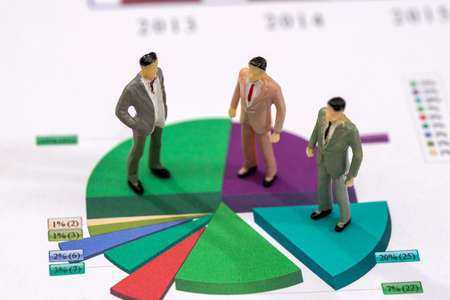
People take view business growth graphs
Коллекция по умолчанию
Коллекция по умолчанию
Создать новую
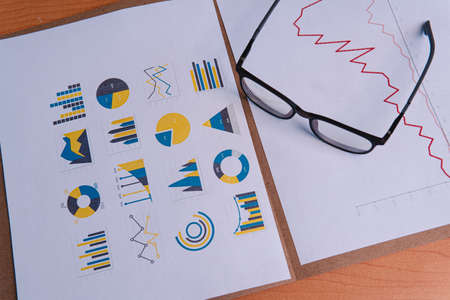
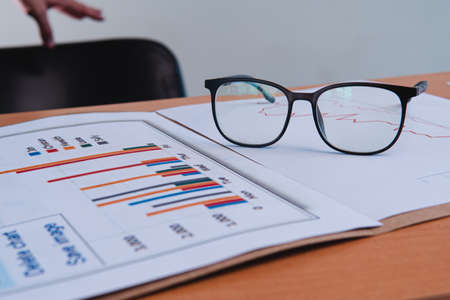
Business themed presentation templates. Background with papers full of graphs and executive glasses. Folder with papers full of graphs and glasses on a table. High quality photo
Коллекция по умолчанию
Коллекция по умолчанию
Создать новую
An office worker shows his colleagues a presentation with a company development graph at night on the company's computer
Коллекция по умолчанию
Коллекция по умолчанию
Создать новую
close-up business graph paper on working table
Коллекция по умолчанию
Коллекция по умолчанию
Создать новую

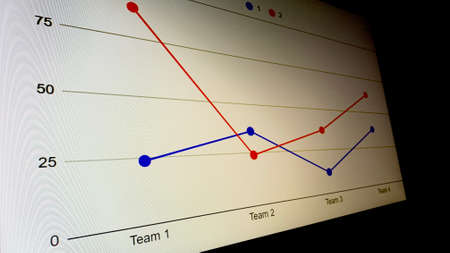
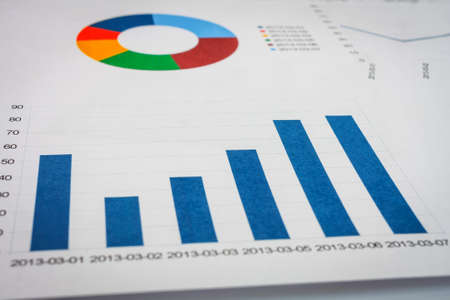
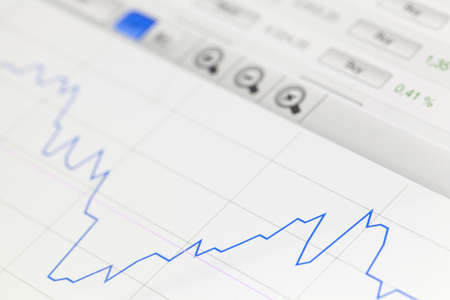
Shallow depth of field (selective focus) with details of a chart showing the stock market crash from March 2020 due to the Covid-19 pandemic on a computer screen (S&P500 index)
Коллекция по умолчанию
Коллекция по умолчанию
Создать новую
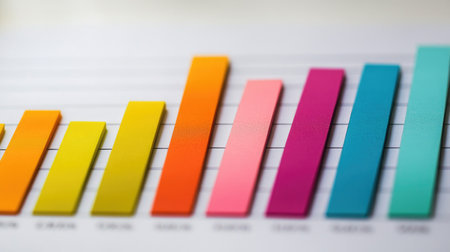
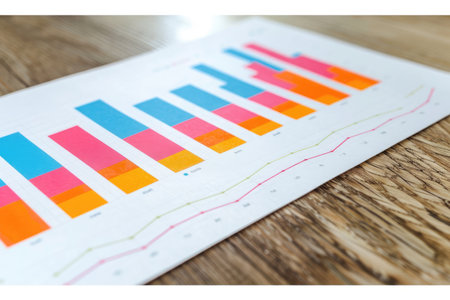
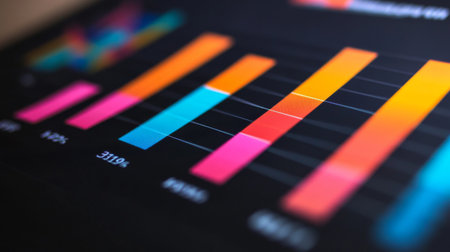
A colorful bar chart representing stock performance over time, with various heights and vibrant colors, set against a clean, professional backdrop.
Коллекция по умолчанию
Коллекция по умолчанию
Создать новую
Charts Graphs spreadsheet paper. Financial development, Banking Account, Statistics, Investment Analytic research data economy, Stock exchange Business office company meeting concept.
Коллекция по умолчанию
Коллекция по умолчанию
Создать новую
Close up of business graph analysis document
Коллекция по умолчанию
Коллекция по умолчанию
Создать новую
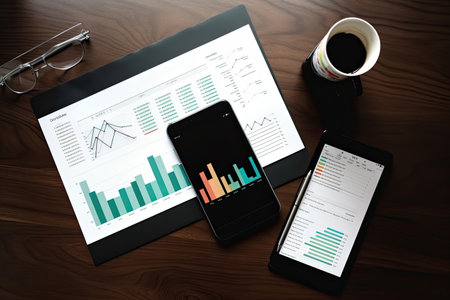
Smartphone and Tablet pc with financial charts and graphs on office desk, business concept
Коллекция по умолчанию
Коллекция по умолчанию
Создать новую
Business documents at workplace, financial report, close up
Коллекция по умолчанию
Коллекция по умолчанию
Создать новую

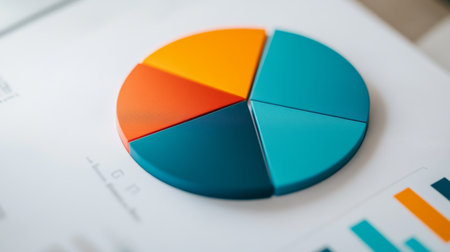
Close up image of colored wooden blocks as a graph
Коллекция по умолчанию
Коллекция по умолчанию
Создать новую
Charts Graphs paper. Financial development, Banking Account, Statistics, Investment Analytic research data economy, Stock exchange Business office company meeting concept.
Коллекция по умолчанию
Коллекция по умолчанию
Создать новую

reports and histograms on paper on the table, analytics and statistics on paper, business analytics
Коллекция по умолчанию
Коллекция по умолчанию
Создать новую
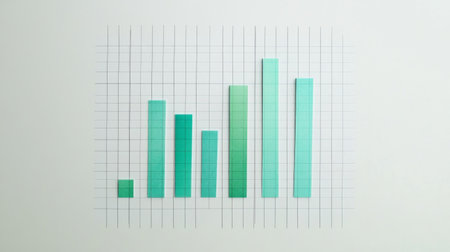
A financial bar chart showing comparison of investment returns, with green bars rising sharply to symbolize growth, displayed against a white background with grid lines.
Коллекция по умолчанию
Коллекция по умолчанию
Создать новую

top view of man hand with pen analyzing bar chart on paper.
Коллекция по умолчанию
Коллекция по умолчанию
Создать новую
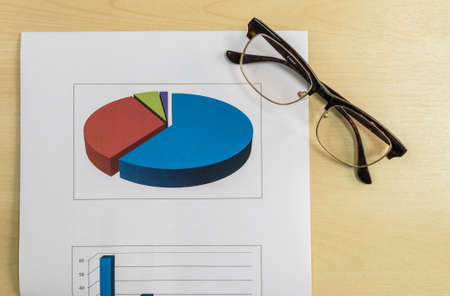
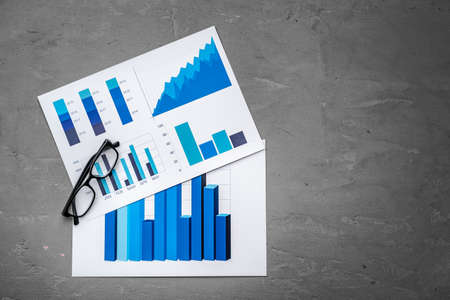
Graph of market share with glasses in business concept
Коллекция по умолчанию
Коллекция по умолчанию
Создать новую
Work table of a businessman with papers, graphs and glasses. Business presentation template with papers, folder and a chair in the background. High quality photo
Коллекция по умолчанию
Коллекция по умолчанию
Создать новую
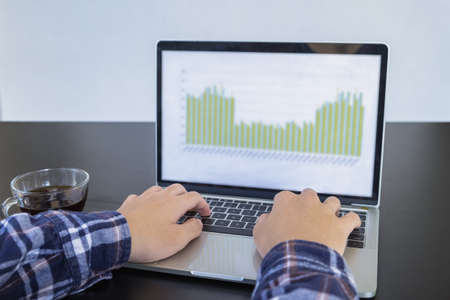
Learn online, Student watching lesson online and studying from home. Young man taking notes while looking at computer screen following professor on video call. Studying from home on pc.
Коллекция по умолчанию
Коллекция по умолчанию
Создать новую
Close up of business graph analysis document
Коллекция по умолчанию
Коллекция по умолчанию
Создать новую
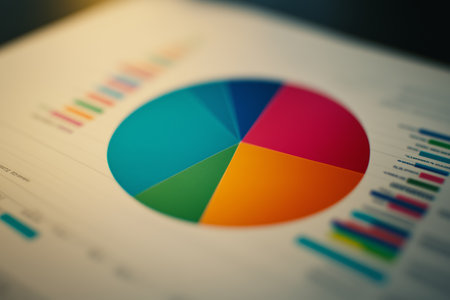
Colorful pie chart on a financial report with data visualizations displayed in a business setting in the afternoon
Коллекция по умолчанию
Коллекция по умолчанию
Создать новую
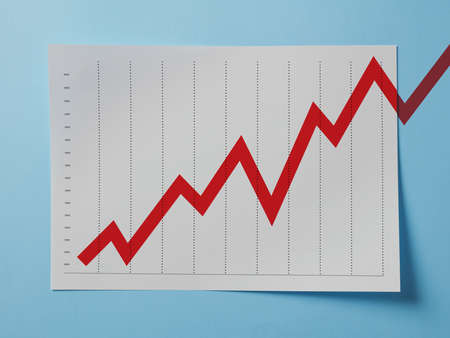
Growing chart on A4 page on blue background
Коллекция по умолчанию
Коллекция по умолчанию
Создать новую
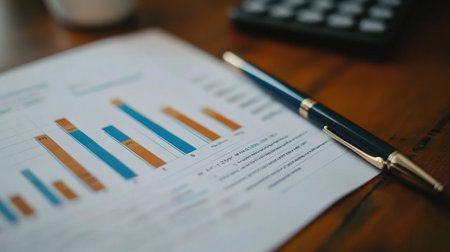
A close-up of a banking report featuring detailed financial graphs, with a pen and calculator placed nearby, symbolizing the analysis of financial performance.
Коллекция по умолчанию
Коллекция по умолчанию
Создать новую
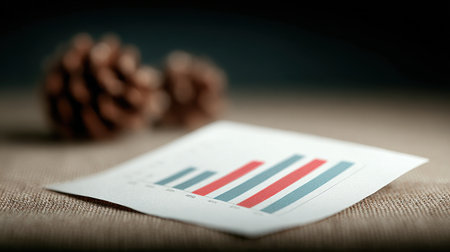
A piece of paper with a graph on it is on a table. The graph is a bar chart with a red and blue line. The paper is crumpled and has a few creases
Коллекция по умолчанию
Коллекция по умолчанию
Создать новую
Notebook showing creative mind maps, charts, and highlighted study material for visual learners
Коллекция по умолчанию
Коллекция по умолчанию
Создать новую
Development and growth concept. Businessman plan growth and increase of positive indicators in his business.
Коллекция по умолчанию
Коллекция по умолчанию
Создать новую

Business finance person is reviewing a company's financial documents prepared by the Finance Department for a meeting with business partners. Concept of validating the accuracy of financial numbers.
Коллекция по умолчанию
Коллекция по умолчанию
Создать новую
This image showcases a colorful bar graph that visualizes data insights for business analysis. The vibrant colors highlight various metrics and trends.
Коллекция по умолчанию
Коллекция по умолчанию
Создать новую
Stock Market Chart on Blue Background. share drop down and stock up
Коллекция по умолчанию
Коллекция по умолчанию
Создать новую
Charts, diagrams, tables. Workplace for the business person.
Коллекция по умолчанию
Коллекция по умолчанию
Создать новую
Man showing business graph on wooden table
Коллекция по умолчанию
Коллекция по умолчанию
Создать новую
Closeup side view of woman hand holding analyzing graphs and diagrams, statistic. Indoor studio shot isolated on yellow background.
Коллекция по умолчанию
Коллекция по умолчанию
Создать новую

A statistical report with a diagram lies on the table
Коллекция по умолчанию
Коллекция по умолчанию
Создать новую
Grow Stock market trading graph in graphic concept.financial investment or economic trends business design. Abstract finance background.Low angle shot.
Коллекция по умолчанию
Коллекция по умолчанию
Создать новую
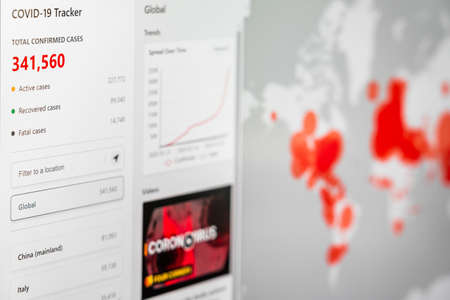
BUCHAREST, ROMANIA - MARCH 23, 2020: Coronavirus Total Cases Of The Pandemic Spreading All Around The Globe In March
Коллекция по умолчанию
Коллекция по умолчанию
Создать новую
Medium shot of a closeup on charts and graphs illustrating loan interest rate fluctuations over time
Коллекция по умолчанию
Коллекция по умолчанию
Создать новую

Business graph analysis documents on gray background
Коллекция по умолчанию
Коллекция по умолчанию
Создать новую

image is a graph of financial development on a computer monitor.
Коллекция по умолчанию
Коллекция по умолчанию
Создать новую
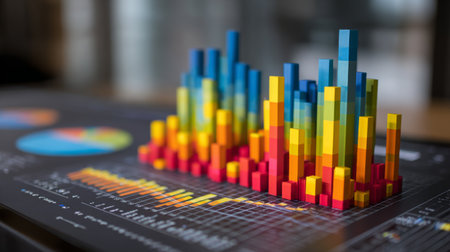
Vibrant 3D bar chart sits on a digital workspace, showcasing data analysis. The image represents growth, trends, and technology in modern business presentations.
Коллекция по умолчанию
Коллекция по умолчанию
Создать новую

Strategic Insights: A Wooden Canvas of Business Growth Analytics
Коллекция по умолчанию
Коллекция по умолчанию
Создать новую
Financial graphic chart
Коллекция по умолчанию
Коллекция по умолчанию
Создать новую
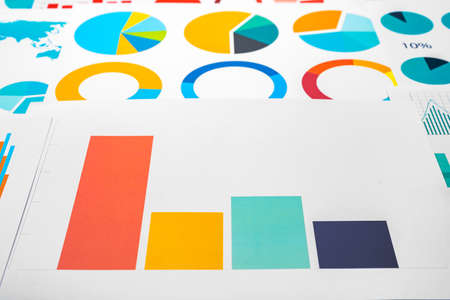
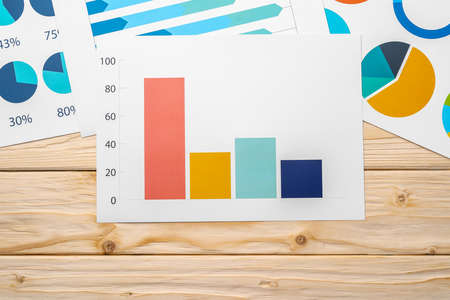
A close-up of a printed bar graph with colorful segments, highlighting financial performance and business metrics in a conference room setting.
Коллекция по умолчанию
Коллекция по умолчанию
Создать новую
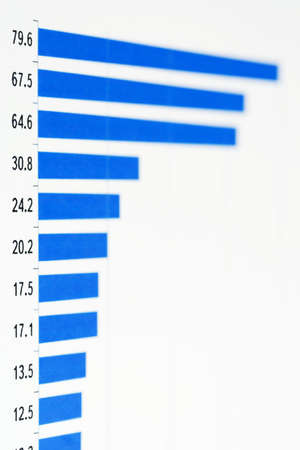
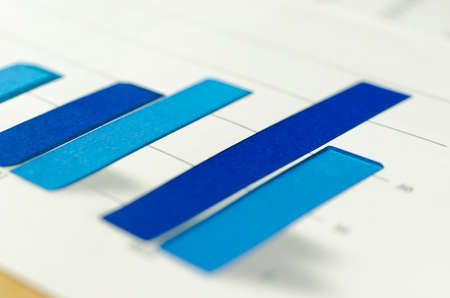
A close-up of a vertical bar chart with varying heights of bars, highlighting trends and comparisons between different data sets with a clean, white background
Коллекция по умолчанию
Коллекция по умолчанию
Создать новую
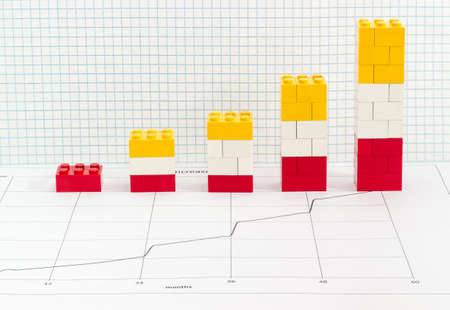
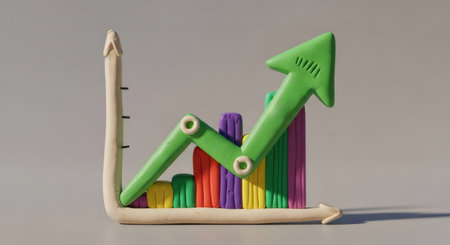
Stacked bar chart with bars which are made from colored plastic parts children's designer on the sheet with line chart against background of squared paper
Коллекция по умолчанию
Коллекция по умолчанию
Создать новую
graph chart of stock market investment trading.
Коллекция по умолчанию
Коллекция по умолчанию
Создать новую

image of the financial graph on a computer monitor.
Коллекция по умолчанию
Коллекция по умолчанию
Создать новую
Colorful financial bar chart demonstrating growth and upward trend. Business development progress, data visualization for market analysis.
Коллекция по умолчанию
Коллекция по умолчанию
Создать новую
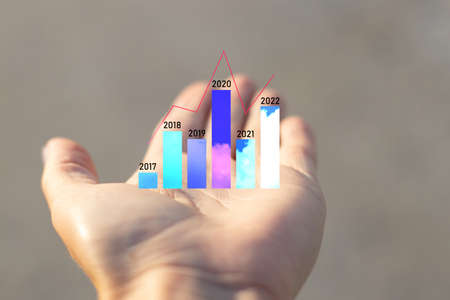
histogram with columns and years in the palm of the hand girl, analysis of years from 2017 to 2022, subview of totals, histogram
Коллекция по умолчанию
Коллекция по умолчанию
Создать новую
business background grown up concept the business chart document background.
Коллекция по умолчанию
Коллекция по умолчанию
Создать новую

Statistical financial graph predicting an economic depression after a 2020 global coronavirus pandemic.
Коллекция по умолчанию
Коллекция по умолчанию
Создать новую
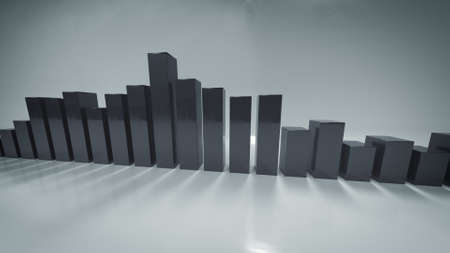
Gray bars of spectrum analyzer with reflection. Abstract music concept. 3D render illustration
Коллекция по умолчанию
Коллекция по умолчанию
Создать новую
Financial accounting
Коллекция по умолчанию
Коллекция по умолчанию
Создать новую
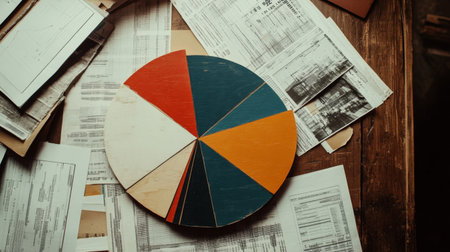
A colorful chart rests on a wooden table surrounded by various documents, showcasing a creative workspace with artistic and analytical elements.
Коллекция по умолчанию
Коллекция по умолчанию
Создать новую
analyzing company's financial balance sheet working with digital augmented reality graphics. Businessman calculates financial data for long-term investment.
Коллекция по умолчанию
Коллекция по умолчанию
Создать новую
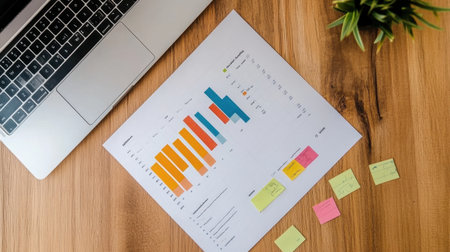
A neatly arranged workspace features a colorful bar graph analysis on paper, sticky notes scattered around, and a laptop on a wooden table, symbolizing productivity.
Коллекция по умолчанию
Коллекция по умолчанию
Создать новую
A detailed view of an open business report showcasing colorful graphs and charts on a wooden table, creating a professional workspace atmosphere for analysis and strategy.
Коллекция по умолчанию
Коллекция по умолчанию
Создать новую
Group of business people meeting in conference room brainstorming consult business document graph chart office desk. Diversity multiethnic group of business people brainstorming and working together.
Коллекция по умолчанию
Коллекция по умолчанию
Создать новую
A vibrant pie chart representing business data analysis. This graphic can enhance reports and presentations, providing clear visual insights into market statistics and trends.
Коллекция по умолчанию
Коллекция по умолчанию
Создать новую
Business paperwork present with diagram.
Коллекция по умолчанию
Коллекция по умолчанию
Создать новую

Data visualization showing trends and user interaction metrics over time in digital format
Коллекция по умолчанию
Коллекция по умолчанию
Создать новую
Business reports Teamwork on table report of documents Blue graphs and charts financial paperwork and reports
Коллекция по умолчанию
Коллекция по умолчанию
Создать новую

Analyzing financial stock market uptrend on soft colored background for thorough evaluation
Коллекция по умолчанию
Коллекция по умолчанию
Создать новую
Analysis data graph professional photography
Коллекция по умолчанию
Коллекция по умолчанию
Создать новую
Histograms
Коллекция по умолчанию
Коллекция по умолчанию
Создать новую
Business documents.
Коллекция по умолчанию
Коллекция по умолчанию
Создать новую
Architect plans
Коллекция по умолчанию
Коллекция по умолчанию
Создать новую

responsibility and cooperation of the working team Business cash, business concept
Коллекция по умолчанию
Коллекция по умолчанию
Создать новую
A close-up view of a blue and black line graph on a white background, showcasing trends and data analysis essential for business reporting and decision-making.
Коллекция по умолчанию
Коллекция по умолчанию
Создать новую

reports and histograms on paper on the table, analytics and statistics on paper, business analytics
Коллекция по умолчанию
Коллекция по умолчанию
Создать новую
A close-up of a line graph showing fluctuating trends, used to analyze market behavior or performance over time.
Коллекция по умолчанию
Коллекция по умолчанию
Создать новую
Business paper Line graph on desk.
Коллекция по умолчанию
Коллекция по умолчанию
Создать новую
Fund managers team consultation and discuss about analysis Investment stock market by digital tablet.
Коллекция по умолчанию
Коллекция по умолчанию
Создать новую
Financial accounting
Коллекция по умолчанию
Коллекция по умолчанию
Создать новую
Business statistics and Analytics value . Abstract glowing forex chart interface background. Investment, trade, stock, finance and analysis concept.
Коллекция по умолчанию
Коллекция по умолчанию
Создать новую
Top view of printed diagrams on paper lying on table
Коллекция по умолчанию
Коллекция по умолчанию
Создать новую
Business document paper placed on a white scene
Коллекция по умолчанию
Коллекция по умолчанию
Создать новую
A detailed line graph shows financial trends marked by an upward movement, reflecting analysis of data for improved decision-making processes.
Коллекция по умолчанию
Коллекция по умолчанию
Создать новую

Shallow depth of field (selective focus) with details of a candlestick chart on a computer screen.
Коллекция по умолчанию
Коллекция по умолчанию
Создать новую
securities price chart on the monitor screen
Коллекция по умолчанию
Коллекция по умолчанию
Создать новую
mini people are on the chart
Коллекция по умолчанию
Коллекция по умолчанию
Создать новую
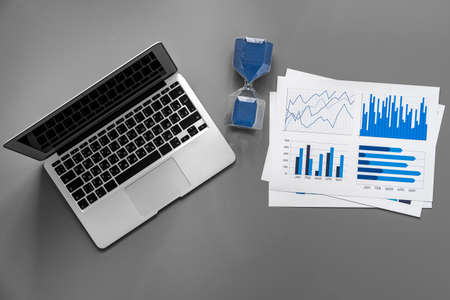
Financial paper with charts and diagrams on gray table
Коллекция по умолчанию
Коллекция по умолчанию
Создать новую
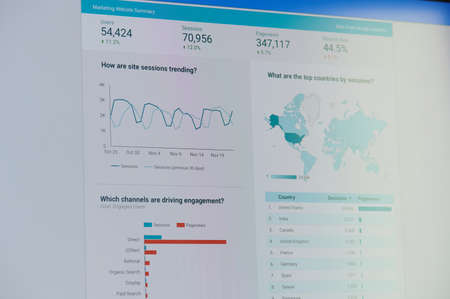
New york, USA - November 24, 2020: Google ads marketing website summarydashboard on laptop screen
Коллекция по умолчанию
Коллекция по умолчанию
Создать новую
Chart graph paper. Finance, account, statistic, investment data economy, stock exchange business.
Коллекция по умолчанию
Коллекция по умолчанию
Создать новую

A close-up of a line graph showing financial growth trends over time
Коллекция по умолчанию
Коллекция по умолчанию
Создать новую
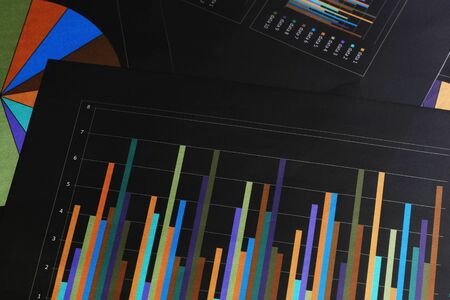
This stock image features a colorful statistical data representation, showcasing various bar charts and line graphs arranged on a wooden table.
Коллекция по умолчанию
Коллекция по умолчанию
Создать новую

The pencil is placed on the financial graph of the businessman.
Коллекция по умолчанию
Коллекция по умолчанию
Создать новую
Notebook work with statistics on sofa business
Коллекция по умолчанию
Коллекция по умолчанию
Создать новую
Office workplace table with report pages with financial data
Коллекция по умолчанию
Коллекция по умолчанию
Создать новую

Business growth chart on a desk with colorful sticky notes, symbolizing entrepreneurship, with copy space
Коллекция по умолчанию
Коллекция по умолчанию
Создать новую

Finance graph
Коллекция по умолчанию
Коллекция по умолчанию
Создать новую
Printed graphs and laptop on dark gray surface
Коллекция по умолчанию
Коллекция по умолчанию
Создать новую
Financial paper with charts and diagrams on gray table
Коллекция по умолчанию
Коллекция по умолчанию
Создать новую
Business document Financial chart and graph.
Коллекция по умолчанию
Коллекция по умолчанию
Создать новую
Vibrant bar graph displayed on a digital screen, showcasing data insights and trends for business analysis. Ideal for presentations and reports.
Коллекция по умолчанию
Коллекция по умолчанию
Создать новую
Legion-Media
Создайте свои проекты на основе качественных стоковых фотографий и видео.


Copyright © Legion-Media.